(SeaPRwire) – By: Christian Pierce
Every election cycle, the crypto market digs up the same ghost. This time it arrives as a warning that U.S. midterms historically precede Bitcoin bear-market bottoms, and that November 3 could trigger another leg down. The anxiety is understandable, but the narrative has a hole in it large enough to drive a whale wallet through. In past cycles, Bitcoin’s lows came after the ballots were counted. The 2014 cycle bottomed in January 2015, about 71 days post-election. The 2018 low landed in December of that year, 38 days out. The 2022 trough arrived just 13 days after the vote. This time the timeline is inverted. Bitcoin hit $57,850 on July 1, roughly 125 days before election day, and by October 22 it was trading near $81,455. That is a 41% recovery already booked before a single vote is cast. The pattern traders are citing does not match the setup they are trading. That mismatch is the core contradiction, and it explains why the fear feels louder than the evidence.
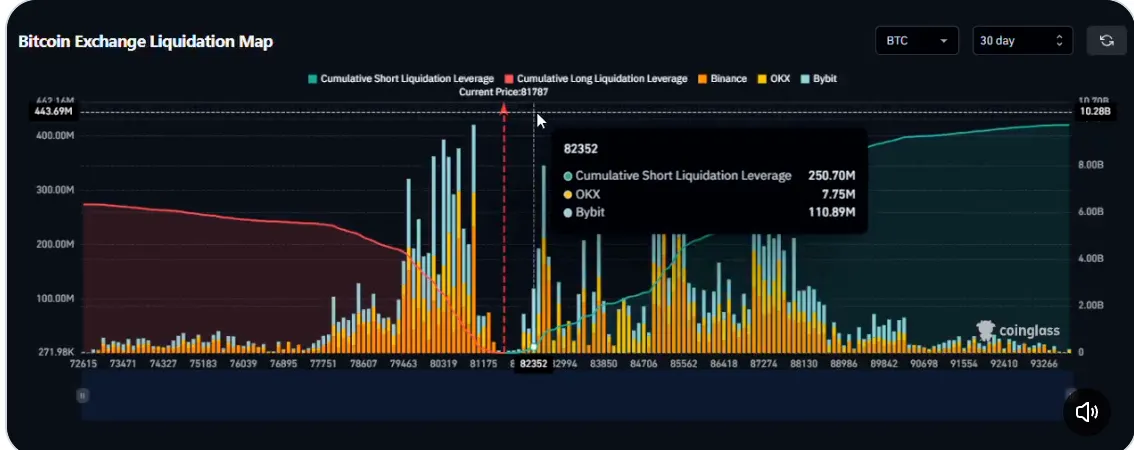
Strip away the folklore and the actual data set is messy. Analyst Ali Martinez points to post-midterm declines of 72%, 65%, 52%, and 27% following the 2010, 2014, 2018, and 2022 elections. Read one way, that sounds damning. Read another, it falls apart. A review of monthly post-election returns actually shows gains after the first two of those votes. Quarterly framing is no cleaner. Martinez records fourth-quarter losses of 16.7% in 2014, 42.16% in 2018, and 14.75% in 2022, yet Bitcoin gained 391% in the final quarter of 2010. There is no consistent election effect here, only a small sample stretched to fit a bearish mood. The macro overlay muddies it further. QQQ fell 23% between September and December 2018 and dropped 17% before the 2022 election, but gained 17% ahead of the 2014 vote. Crypto was not trading in a vacuum in any of those years. Meanwhile, the current tape has its own tension. Lookonchain flagged a whale moving 4,000 BTC, about $327 million, into Binance and Deribit within five hours. Deposits can precede selling, but the transfer alone proves nothing about intent. Trader Ted Pillows sees short-side liquidity stacked between $79,500 and $80,600 and floats a dip below $80,000 followed by a reversal. Martinez puts $73,000, his estimate of recent buyers’ average cost basis, as the level that would truly test demand. U.S. spot Bitcoin ETFs took in $526.6 million on October 19, yet the inflow produced no sustained rally. Over 30 days, both Bitcoin and QQQ are down about 6%. Over 90 days, Bitcoin is up 26% against QQQ’s 3%.
Follow the commercial loop and the picture sharpens. The midterm-selloff thesis is not analysis. It is positioning dressed as history. Whales moving coins to exchanges, influencers circulating conditional targets like $73,000, and liquidity maps clustering just below $80,000 all serve the same function. They create a self-referential trade where the narrative manufactures the volatility it claims to predict. Market makers harvest the liquidity pockets at $79,500 to $80,600 regardless of who wins Congress. ETF desks monetize flows in both directions, as the $526.6 million inflow day that went nowhere demonstrates. The endgame here is not a repeat of 2018 or 2022, because those drawdowns were macro events wearing an election costume. The real tell is structural. An asset that has already corrected 41% and recovered, with institutional pipes absorbing half-billion-dollar flow days, does not sell off because of a date on a calendar. It sells off if $73,000 breaks and recent buyers capitulate in size. Watch that cost basis, not the ballot count. Traders anchoring on election-day history are fighting the last war, and the market will happily take their money for it.
Author bio: Christian Pierce, a chief financial columnist and markets commentator who has covered digital asset cycles, macro liquidity, and institutional crypto flows for over a decade.