Miners, Megawatts, and a Mystery Lab: What the Anthropic–IREN Deal Really Tells Us About the Compute Crunch

(SeaPRwire) - By: Ethan Gallagher I have sat in enough datacenter design reviews to know when a market signal matters more than the press coverage around it. The reported multi-year cloud deal between IREN and Anthropic, surfaced by The Information and still unconfirmed by both parties, is one of those signals. IREN stock popped 5% in Monday premarket trading, after an overnight move of roughly 8% on Sunday, according to Stocktwits. That reaction tells me the market is not pricing a single contract. It is pricing a structural shift in who gets to sell compute to frontier AI labs. When I walk client sites these days, the first question is never about GPU models. It is about power delivery timelines. That is the entire story here, compressed into one ticker. Here are the released facts. IREN told investors back in August, on its fiscal fourth-quarter earnings call, that it had signed multi-year cloud contracts with Cohere, Prometheus, Perplexity, Figure AI, Fal AI, and Higgsfield AI. CEO Daniel Roberts also mentioned a deal with "a leading frontier AI lab whose name we're not able to disclose just yet." The new report points to Anthropic as that unnamed customer. The report gave no dollar value and no start date. Anthropic already leans on Amazon and Google for infrastructure. Yet it is reportedly adding miners-turned-cloud-operators, specifically IREN, Hut 8, TeraWulf, and Nscale, to lock in large GPU clusters with more flexibility and at lower cost. The piece also tied the arrangement to Anthropic's planned IPO, noting that cheaper compute could help both its losses and its gross margin in front of public market buyers. Now the industry subtext, and this is where it gets uncomfortable. The first half of the story is that hyperscalers cannot build fast enough, so AI labs are renting from firms that already own power contracts and energized land. That is not a compliment to the miners. It is an admission that the grid, not the chip, is the binding constraint. The second half is rougher. Just last week, SemiAnalysis said on X that multiple customers and end users described IREN's legacy British Columbia sites, Prince George and Mackenzie, as among the worst in the industry, with one called the "#1 worst site in the industry." IREN has not been reported to have responded. The criticism targets the older facilities, not the newer AI buildout, but it underlines the gap between a headline deal and physical execution. A contract on paper does not cool a rack. IREN was also down 1.46% in its most recent regular session before Monday's bounce, so this rally sits on top of real doubt. My blunt read, from the infrastructure side, is this. Compute supply has bifurcated into two tiers: hyperscalers selling premium availability, and former bitcoin miners selling raw megawatts at a discount. Frontier labs will arbitrage between the two as long as GPU demand outruns new construction. Anthropic is not choosing IREN for elegance. It is choosing whoever can energize capacity fastest, because every quarter of delay costs it model progress and IPO optics. The miners that own power will consolidate this new customer class; the ones with creaky legacy sites will get exposed by exactly the kind of scrutiny SemiAnalysis applied. In this supply chain, the electricity bill is the moat, and everything else is marketing. Author bio: Ethan Gallagher is a Silicon Valley hardware architect and infrastructure strategist with two decades designing datacenter power and cooling systems, advising cloud operators and investors on compute capacity economics.
More

The $35 Target Nobody Saw Coming: Fastly’s AI Gamble Isn’t Hype, It’s Infrastructure Math

(SeaPRwire) - By: Lucas Caldwell Fastly isn't having a good month if you go by price action. It traded near $27.88 in early October, still 16.8 percent below its April high of $33.50. The stock has bounced 6 percent in pre-market trading after Oppenheimer upgraded it to Outperform from Perform. A $35 price target landed on the desk of senior analyst Param Singh. The move is not an emotional swing. It is structural. Singh is betting the market is still pricing Fastly like a legacy CDN provider. That pricing model is broken. Oppenheimer projects third-quarter revenue at the very top of Fastly's own guidance range. That means $184 million to $190 million. They expect management to lift its full-year 2026 revenue growth outlook to between 20 and 21 percent. The new number is not made up. It includes roughly $10 million in revenue tied to Grand Theft Auto VI traffic. It also counts early monetization from Fastly's AI Runtime, AI Firewall, and API Enforcement suites, all of which moved to general availability in September. Singh says his firm's own checks show average deal sizes grew during the quarter. Customers are buying more of the newly launched security tools. That is a measurable signal coming from the sales floor. The thesis rests on agentic AI traffic. As AI agents scale, network volumes will climb. Bot management demand follows naturally from that volume growth. Oppenheimer calls it an unpriced revenue ramp. The valuation math is stark. At the $35 target, the stock trades at seven times estimated 2027 enterprise value to sales. The peer median sits at 10.6 times. Fastly has posted three straight quarters of steady revenue growth. BofA raised its target to $22 from $20 for that reason alone. DA Davidson keeps a Neutral rating and cut its target to $23 from $26 on valuation concerns. RBC Capital held a Sector Perform with a $25 target. Eleven analysts have already revised earnings estimates upward. Fastly is expected to reach profitability this year despite not being profitable over the trailing twelve months. This name has been brutal to trade. It recorded 75 moves greater than 5 percent over the past year. Fourteen percent single-day swings are baseline volatility here. The last big move came 15 days ago when the stock fell 4.2 percent as rising yields pressured tech names and investors took profits after the investor day. The day before that, it surged roughly 14.3 percent after management laid out long-term financial targets through 2029, including a revenue growth range of 14 percent to 21 percent. Social media chatter has linked Fastly to traffic from Meta's Muse AI assistant. DA Davidson acknowledges AI agents could add some traffic but does not expect large revenue gains in the near term. A $1,000 investment made five years ago would now be worth $673.67. The stock is up 173 percent this year. Oppenheimer expects high-teens to low-20s growth over the coming years. The market underrates that path and will re-rate the stock if management delivers on growth and margin expansion. That is the bet. The question is whether you trust the edge infrastructure thesis or keep waiting for a cheaper entry. Author bio: Lucas Caldwell is a tech opinion leader with millions of followers on X/Twitter, known for blunt infrastructure plays and zero tolerance for vendor spin.
More
Oracle’s AI Gamble: Why a Director Bought While the CEO Sold Business

Oracle’s AI Gamble: Why a Director Bought While the CEO Sold

(SeaPRwire) - By: Reginald Vance Oracle’s stock sits at $141.56, well below its 50-day moving average of $146.35 and 200-day average of $159.03. The market is nervous. The core issue is not just the price action. It is the massive capital expenditure required to support OpenAI. Reports float around that OpenAI’s annual recurring revenue is between $50 billion and $70 billion. That number swings the stock. Oracle is the infrastructure backbone for that growth. But the cost to build that backbone is eating into cash flow. The company is seeking large private financing to buy AI chips. This is not a software margin story anymore. It is a heavy industrial asset story. The official release paints a picture of steady performance. Oracle beat earnings estimates on Sept. 10. EPS came in at $1.92 against a $1.74 estimate. Revenue rose 29.6% to $19.34 billion. The company guided second-quarter fiscal 2027 EPS to $1.85 to $1.93. Analysts rate the stock Moderate Buy with a $251.72 consensus target. Mizuho added Oracle to its top picks with a $320 price target. The public narrative focuses on cloud infrastructure demand. The subtext is risk. Insiders sold about $5.34 million in the last 90 days. CEO Michael Sicilia sold 22,562 shares at $151.59 on Sept. 22. This was a pre-arranged 10b5-1 plan. Even so, selling into strength signals caution. Mar Vista exited its position. They said the rally reduced their margin of safety. Smart money is taking profits. Contrast this with the buying side. Director Stephen Rusckowski bought 25,000 shares on Sept. 29. He paid between $138.96 and $139.74. That is roughly $3.5 million. This was his first open-market purchase since joining the board nearly a year ago. He is a former CEO of Quest Diagnostics. His trust held 25,390 shares before this buy. Now he owns more. Why buy when the CEO is selling? Rusckowski likely sees value in the data center buildout. Oracle is trucking natural gas to keep construction moving. They have a 2.45 gigawatt project in New Mexico. The hardware is going in. The revenue stream from OpenAI is locked in for years. The risk is the debt load to finance the chips. The technical chart shows a stock that has steadied after its slide from the June peak. Since the $114.50 low in late July, price has made higher lows. The latest close of $141.40 bounced off a support zone near $135 to $140. RSI reads 48.18. That is neutral. MACD is flat. No bullish crossover yet. Resistance sits at $150 to $155. A close below $135 opens the door to $114.50. Holding above it keeps the structure intact. Moving through $155 signals buyers are in control. Oracle is no longer just a database company. It is a utility for AI. The hardware supply chain is the bottleneck. If you cannot secure power and chips, the revenue promise evaporates. The director’s buy is a vote of confidence in the physical assets. The CEO’s sell is a standard risk management move. The market will pay for the gigawatts, not the code. Author bio: Reginald Vance, a venture partner specializing in semiconductor valuation and advanced materials.
More
The Banks Are in Damage Control. SpaceX Just Stole Their Cover Story. Business

The Banks Are in Damage Control. SpaceX Just Stole Their Cover Story.

(SeaPRwire) - By: Robert Kensington The S&P 500 closed Friday at 7,811.54. Up 0.59% on the day. Up 1.2% on the week. The Nasdaq added 0.9%. The Dow gained 0.6%. On the surface, this looks like a strong close. But the picture fractures when you dig one inch below the hood. The five major banks have lost roughly $270 billion in market value. The financial sector dropped about 4% over the past month, making it the second-worst performer among all S&P 500 sectors. Truist Securities found that only 35% of institutional investors expect bank stocks to beat the market. That number was 68% in July. In just two months, conviction has been cut in half. That is not a mood swing or a passing anxiety. That is a structural break in how the market prices banking risk. The street has stopped believing the recovery narrative for big banks, and the upcoming earnings reports will either confirm that skepticism or force a second-guess. On Tuesday, JPMorgan Chase, Goldman Sachs, Wells Fargo, and Citigroup open Q3 earnings season. UnitedHealth and Johnson & Johnson report the same day. Bank of America and Morgan Stanley follow Wednesday. BlackRock and ASML are also on the docket. Analysts expect bank profits to fall from the prior quarter. Trading and investment banking revenue are expected to decline as well. Goldman Sachs CEO David Solomon said in late September that trading in fixed income, currencies, and commodities had been "a little bit softer" than a year earlier. Morgan Stanley co-president Daniel Simkowitz put it bluntly: "I think it's safe to say 3Q is no 2Q." The official narrative is one of caution and cooling. The language is deliberately measured. "A little bit softer." "Safe to say." These are not descriptions of a market in free fall. They are descriptions of a market being managed downward by executives who want to preserve the option of further tightening without looking like they are panicking. The subtext is starker. Banks were the trade engine last quarter. That engine has sputtered. The higher rates that supposedly benefit banking margins through net interest income have started throttling loan demand. The theory says banks earn more on loans compared to what they pay on deposits. In practice, fewer borrowers means narrower revenue. Bank executives described the economy as healthy this summer. Trading volume was up. Merger activity was brisk. But none of that translates to quarter-over-quarter earnings growth. The official announcement reads like a managed retreat. The true commercial intention is damage control. The banks are not in crisis. They are in a period of margin compression that will either be resolved by rate cuts or become permanent structural erosion. This is the central tension of the earnings season. Every bank will try to tell a story of resilience. The street will read every one of them as a story of decline. Taiwan Semiconductor reports Thursday. ASML reports Wednesday. TSMC beat profit estimates last quarter but its shares fell after the report. That pattern tells you everything about market psychology at this stage of the cycle. Wall Street has priced in perfection. Any miss becomes a sell trigger regardless of absolute numbers. The September CPI lands Wednesday. Economists expect prices to rise 3.6% from a year earlier, up from 3.4% in August. Prices for gasoline, food, and computer parts have climbed since the war in Iran began in late February. Fed Chair Kevin Warsh said in September: "The plain fact is that inflation is too high and has been for too long." The Fed raised rates by a quarter point in September. That was the first hike in three years. The target range is now 3.75% to 4%. Most Fed officials projected at least one more quarter-point hike this year. Traders now price in roughly 80% odds of an October increase. Bank of America economist Stephen Juneau said the CPI report may not be strong enough to shift expectations toward an October hike. New York Fed president John Williams has also signaled room to wait. Retail sales and the Producer Price Index arrive Thursday. Industrial production data follows Friday. The CPI number will not change the Fed's mandate. But it will change the market's confidence that the Fed has any room to pivot lower. Telecom stocks dropped Friday after SpaceX said it agreed to buy a nationwide low-band spectrum portfolio from Grain Management. Verizon fell 5%. AT&T dropped nearly 7%. T-Mobile declined more than 6%. SpaceX COO Gwynne Shotwell said in August that Starlink plans to build a wireless network. SpaceX shares closed Friday at $162.57, up 1.25%. This is the canary in the coal mine that nobody wanted to see. The old guard is bleeding market share to entrants that do not play by the same rules. Banks are bleeding to rate pressure and softer trading volumes. Telecoms are bleeding to SpaceX's satellite-to-wireless ambition. The market is not growing evenly. It is consolidating around whoever can move fastest and borrow cheapest. Whoever cannot do both will become acquisition targets or industry footnotes. The earnings season this week will not deliver surprises. It will deliver confirmations. Bank margins will compress. Trading desks will underperform. Chip results will be judged against thresholds set before the earnings even land. The landscape is already set. The question is only how quickly the market will absorb what everyone already knows. Author bio: Robert Kensington, an overseas entrepreneurial veteran with decades of experience in real-economy industrial investment and expansion.
More
The $7B Decart Bet: Why Amazon Is Buying Its Way Out of the Nvidia Trap Business

The $7B Decart Bet: Why Amazon Is Buying Its Way Out of the Nvidia Trap

(SeaPRwire) - By: Ethan Gallagher People are treating this as another standard SaaS acquisition. That view misses the point entirely. Amazon isn’t buying developer tools. It is buying a wedge into the silicon independence war. The gap between Decart’s May valuation of nearly $4 billion and the reported $7 billion talks is stark. Five months. No major product launch. No new revenue stream disclosed. The jump signals scarcity. Competitors want this software. Nvidia knows its lock on the GPU market is eroding. Amazon is paying a premium to secure a lifeline for its Trainium3 chips. The narrative is simple. If developers can easily switch chips, the moat cracks. Let’s look at the facts versus the subtext. The Wall Street Journal reports talks for a $7 billion deal. Decart’s software allows developers to move AI workloads between different chips easily. On the surface, this is a convenience feature. In reality, it is a direct attack on Nvidia’s install base. Amazon gave Decart early access to Trainium3 in 2025. They liked what they saw. Now they want full control. The subtext is clear. Amazon wants to reduce friction for customers moving to its own hardware. Every hour a developer spends porting code is an hour lost to Nvidia’s ecosystem. Decart removes that friction. It makes the switch trivial. That is worth $7 billion to AWS. Consider the technical fit. Decart builds world models called Lucy and Oasis. These generate 3D environments for robotics and autonomous driving. This aligns with Amazon’s broader AI strategy. It is not just about chips. It is about the simulation layer. If you are building the next generation of warehouse robots or delivery drones, you need simulated environments to train them. Decart provides that. The startup was founded in 2023 by Dean and Orian Leitersdorf and Moshe Shalev. They have raised over $400 million from Sequoia Capital, Benchmark, and Radical Ventures. Now Amazon is offering them an exit. Or rather, a merger of operations. The founders get liquidity. Amazon gets the tech stack. The investors get their returns early. The market reaction tells the story. AMZN stock rose 3.29% on the news. Wall Street consensus remains Strong Buy with an average target of $332.35. Analyst Laura Martin keeps her Buy rating, arguing AI shopping agent fears are overstated. The technical indicators support the momentum. RSI is at 59. MACD just crossed positive. The stock is holding the $259 support zone. Resistance sits at $286. If the deal closes, the stock likely tests the upper channel. The supply chain landscape shifts. Chip vendors can no longer rely on software lock-in. The hardware becomes commodity-like. The value migrates to the layer that abstracts it. Amazon is betting that layer is where the long-term margin lives. Amazon is not paying for code. It is paying for the right to make hardware optional. If that fails, the $7 billion price tag becomes a cautionary tale for the rest of the valley. Author bio: Ethan Gallagher, Silicon Valley hardware architect and infrastructure strategist. Specializes in semiconductor supply chain dynamics and cloud computing market structures.
More
Micron at $1,029: Wall Street Screams Buy While the CEO Quietly Walks Out the Side Door Business

Micron at $1,029: Wall Street Screams Buy While the CEO Quietly Walks Out the Side Door

(SeaPRwire) - By: Lucas Caldwell Everyone posting "buy the dip" on Micron right now is ignoring the single loudest signal in the tape: the people running the company are selling it. MU trades near $1,029, down 18% from its June 25 record close of $1,255. CEO Sanjay Mehrotra unloaded $38.8 million of stock on August 21 at an average of $968.90, cutting his stake by 13%. Total insider sales hit $90.9 million over three months. Insiders now own 0.24% of the company. Meanwhile retail traders on my timeline are calling this the entry of the decade. Somebody is wrong here, and my money says it is not the CEO. The bull numbers are real, and they are wild. Fiscal fourth-quarter revenue exploded 379% to $54.23 billion, smashing the $51.33 billion forecast. EPS printed $33.42 against a $31.77 consensus. Net margin sat at 63.8%. Guidance for fiscal Q1 2027 calls for EPS between $37.15 and $39.15. More than 75% of fiscal 2027 shipments are reportedly committed. HBM needs three times the wafer capacity of standard DRAM, which has squeezed DRAM supply across PCs, phones, and servers and pushed prices upward. Analysts model 55% revenue and 67% EPS growth from fiscal 2026 to 2028. The valuation pitch sounds absurd on paper. Roughly six times expected earnings for this year. Wall Street carries one Strong Buy, 41 Buys, four Holds. Consensus target: $1,407.88. Rosenblatt went to $1,900. Zacks upgraded to Strong Buy. Market cap hovers near $1.2 trillion, with the stock miles above its 50-day at $980.05 and 200-day at $841.86. On a spreadsheet, this is the cheapest AI story alive. Spreadsheets, of course, are exactly where memory stocks go to lie to you. Now the part the bulls skip. Memory is a serial killer of portfolios. Micron dropped 73% from 2014 to 2016, 55% in 2018, 43% in 2020, 51% in 2021, 36% in 2024. Shortages become gluts. They always do. Every cycle ends with makers overbuilding capacity into a demand wall. The options market already smells it. Put volume in the SMH ETF far exceeded call volume, signaling heavy hedging across chips. Add softer-than-expected OpenAI revenue data, slower profit growth at Samsung, and a Taiwan union authorizing strike action over bonuses. The anxiety is stacking. The chart confirms the hesitation. MU has churned sideways since the June peak, bounced off $740 in late July, rode a rising trendline to about $1,100 in September, then rolled over. Price closed below the $1,035 level, flipping it to resistance. The trendline sits near $1,016. Next real support is $900. RSI reads 50.20, cooled from the 60s in early October. MACD prints 22.36 versus a 28.68 signal line, histogram at negative 6.32. Bearish crossover, fading momentum, volume running light at 19.9 million versus a 32.5 million average. If $1,016 cracks, $900 comes fast, and the "cheapest AI stock" narrative gets stress-tested against the oldest lesson in semis: insiders sell tops, not bottoms. Author bio: Lucas Caldwell, a tech opinion leader with millions of followers on X/Twitter, known for contrarian semiconductor calls and stripped-down tape analysis.
More
The 11-Cent Peace: Trump’s Energy Ceasefire Is a Diesel Deal in Disguise Business

The 11-Cent Peace: Trump’s Energy Ceasefire Is a Diesel Deal in Disguise

(SeaPRwire) - By: Julian Holbrooke A ceasefire that no party confirms is a press release with oil futures attached. Trump announced Russia and Ukraine agreed to stop attacking energy facilities. Brent fell 11 cents to $104.61 a barrel by 0627 GMT. WTI fell 49 cents to $91.36. Earlier both benchmarks were down more than 1%. Some of that was profit-taking after crude gained nearly 3% last week. But the scale of the drop matters. A real de-escalation would have triggered a far bigger selloff. A peace breakthrough would not produce eleven cents of movement. The market is treating this as a supply announcement, not a strategic turning point. That distinction is the entire story. The official version is simple. Trump says Russia will immediately supply more than 300,000 metric tons of diesel to the US and global markets. Another 500,000 tons arrives in November. One million tons follows after that. ICE gasoil futures dropped 3% to $1,436 per metric ton. The IEA sees global daily diesel demand near 29 million barrels. Executive Director Fatih Birol asked member countries to assess whether more diesel releases are needed. Tim Waterer at KCM Trade says the announcements eased some immediate supply pressure. The geopolitics are murkier. Zelenskiy says he is still waiting for details. Russia has not commented at all. This is not a small omission. Trump announced the same energy ceasefire in mid-September. Neither side confirmed that one either. A pattern emerges. Washington announces, Moscow stays silent, Kyiv waits, and the market moves a little. The actual negotiating track remains invisible. What is visible is a US administration that wants diesel flowing into global markets before winter demand peaks. The ceasefire and the diesel supply announcement landed in the same news cycle. That is not a coincidence. The second half of the story is where the real risk lives. The Houthis claimed a Saturday strike on Riyadh's international airport that killed 13 people and wounded more than 300. Saudi authorities reported injuries from a new attack on Sunday. Trump said the US is considering joining Saudi strikes on the Houthis. Tanker attacks near the Strait of Hormuz are accelerating. The UK Maritime Trade Operations recorded a drone strike on a tanker near Sohar anchorage in Oman. Another tanker was hit by an unknown projectile. Iran says a US proposal to reopen the Strait of Hormuz is insufficient. Iran has stepped up attacks on shipping since late September. That strait is the world's most important energy chokepoint. Any sustained disruption there outweighs a few hundred thousand tons of diesel. Then add Hurricane Isaias. It hit the US Gulf Coast early Saturday. Shell, Chevron and BP are working to restore production. More than 60% of Gulf of Mexico output was still offline last week. Goldman Sachs raised its December Brent forecast to $90 a barrel from $85. The bank estimates a risk premium of just over $20 per barrel. It expects WTI to average $81 in December 2026. That forecast is a bet that the war premium shrinks but does not disappear. What does this add up to? A market that refuses to believe the peace story. Russian diesel volumes are real barrels, but they arrive against a backdrop of airport bombings, tanker drones and hurricane-idled platforms. The energy ceasefire is unverified, unconfirmed and already repeating a failed September script. Every silent hour from Kyiv and Moscow erodes its credibility further. The geopolitical pendulum is not swinging toward peace. It is swinging between Washington's need to cool prices and the Middle East's capacity to ignite them. Brent sitting above $100 is the verdict. The diesel deal treats a symptom. The conflict keeps manufacturing new supply shocks. Oil traders are not naive. They know a trade when they see one. This is a trade, not a truce, and the price action proves it. Author bio: Julian Holbrooke, an international relations analyst who contributes to major European daily newspapers, specializes in energy geopolitics, sanctions and great-power bargaining.
More

UnitedHealth’s $27 Coin Flip: Why Tuesday’s Print Is Really a Verdict on the Whole Medicare Advantage Model

(SeaPRwire) - By: Christian Pierce Here is the uncomfortable truth sitting under UnitedHealth's Tuesday morning report: nobody on Wall Street actually knows what this company is worth right now, and the options market is being unusually honest about it. Traders are pricing a 7% move in either direction, roughly $27 on a stock sitting near $379. That is not conviction. That is a coin flip dressed up in Greek letters. The anxiety is rational. UNH is up about 17% this year, yet it was flat over the past month while healthcare providers and services peers climbed roughly 2%. The market is holding its breath because UnitedHealth is the first insurer to report this season. There is no read-through from rivals. Whatever management says about medical costs before Tuesday's open will set the tone for the entire managed care complex, and everyone knows it. The facts themselves are a study in contradiction. Wall Street expects Q3 earnings of $4.15 per share, a big jump from $2.92 a year ago. Revenue is forecast at $111.31 billion, which is below the $113.20 billion posted last quarter and implies a 2% decline year over year. Profit up, top line down. That is a margin story, and margin stories in managed care live and die on medical cost ratios. The company's own history makes the stakes plain. Its last four post-earnings moves ranged from a 20% collapse to a 7% gain, with an average absolute move of about 7%, exactly what options imply. It beat on both revenue and EPS last quarter, but it has missed revenue estimates several times over the past two years. Analysts have mostly held estimates steady over the past 30 days, which means nobody wanted to plant a flag ahead of the print. The sell-side split is telling. Piper Sandler's Jessica Tassan kept her Buy but trimmed her target to $463 from $475, arguing Medicare Advantage star ratings show resilience and writing flatly, "We would be buyers of the stock into 3Q26." TD Cowen's Ryan Langston went the other way, cutting his target to $402 from $430 and keeping a Hold. He calls consensus estimates for medical costs and earnings "more than achievable," yet flags a real problem in Optum Health, where consensus operating earnings of $299 million sit well above management's own guidance of roughly $150 million. He also warns that lower Medicare Advantage star ratings could create a $1.5 billion revenue headwind in 2028. The broader tape still leans bullish: a Strong Buy consensus on TipRanks, 17 Buys against four Holds, and an average target of $485 implying about 28% upside. A September 28 earnings preview memo circulating among traders adds one more layer, pointing to a 2026 plan of adjusted earnings between $19.50 and $20 per share, raised from an older plan, plus at least $5 billion in buybacks. Now follow the commercial loop, because that is where this report actually matters. UnitedHealth's engine runs on two cylinders: the insurance book, where Medicare Advantage reimbursement and star ratings dictate revenue quality, and Optum, where care delivery margins are supposed to smooth the cycle. Langston's note exposes the tension. The Street is modeling Optum Health earnings at nearly double what management has guided. Either consensus is wrong, or management is sandbagging. Neither outcome is neutral for the stock. Layer on the 2028 star-ratings headwind and you see the real endgame. This is not a debate about one quarter's $4.15 print. It is a repricing of how durable the Medicare Advantage economics are under tighter reimbursement, and whether the Optum flywheel can carry the group while the insurance side absorbs policy pressure. The raised 2026 outlook and the $5 billion buyback commitment are management's counter-argument, a signal that cash generation remains intact. If UnitedHealth delivers on cost discipline Tuesday and holds guidance, it validates the Strong Buy consensus and pulls the whole peer group up with it. If medical costs surprise higher or Optum misses that elevated consensus bar, the stock's recent habit of double-digit post-earnings drops reasserts itself fast. For positioning, the practical read is simple: treat the 7% implied move as fair odds, not an edge, and let the print confirm which side of the 2026 plan is real before adding exposure. Author bio: Christian Pierce is a chief financial columnist and markets commentator covering managed care, healthcare services, and insurance economics, with two decades analyzing earnings cycles and capital allocation across the U.S. health sector.
More
Wall Street’s Earnings High-Wire Act: Why 29.6% Growth Won’t Save You From 5.24% Yields Business

Wall Street’s Earnings High-Wire Act: Why 29.6% Growth Won’t Save You From 5.24% Yields

(SeaPRwire) - By: Logan Pierce The S&P 500 is riding high on AI mania and a winning week, but Wall Street is about to walk a very narrow earnings tightrope. JPMorgan Chase, Goldman Sachs, Wells Fargo and Citigroup are reporting Tuesday. Their results will either validate the current rally or expose how much faith investors have already placed in data center buildouts and speculative momentum. Earnings for the S&P 500 are on track for 29.6% growth this quarter. That is the fourth consecutive quarter above 25 percent. FactSet's John Butters puts it plainly — AI data center demand is the engine behind these numbers. Meanwhile, the 10-year Treasury yield sat near 5.24 percent last week, close to a 24-year high. The Nasdaq has gained for four straight weeks. Capital is chasing growth in a rate environment that should logically punish it. South Korea's Kospi fell 3.65 percent and the Kosdaq dropped 4.83 percent on the same day Wall Street smiled. Brent crude traded above $104 a barrel before sliding on news of a Russia-Ukraine energy ceasefire. President Donald Trump announced the deal and also said he was considering joining Saudi Arabia's fight against Houthis after an attack on Riyadh's airport. Kyiv and Moscow had not confirmed the ceasefire. Washington was reportedly pressuring Kyiv to accept or risk losing U.S. military support. Global capital is pricing in stability that may not yet exist. Taiwan Semiconductor Manufacturing reports Thursday. Investors will scan their numbers for signs of sustained AI chip and data center equipment demand. Johnson & Johnson and UnitedHealth Group report Tuesday alongside the banks. Bank of America, Morgan Stanley, BlackRock and ASML follow Wednesday. Brian Leonard of the Keeley Gabelli Small Cap Dividend Fund put it simply. He said investors want to know whether a company can withstand current conditions and keep growing margins. That question cuts deeper than any quarterly beat. September consumer price data arrives Wednesday with economists forecasting headline inflation at 3.6 percent year over year and core at 2.5 percent. Producer prices come Thursday. Retail sales data is also scheduled this week. The Federal Reserve is navigating a landscape where bond yields hover near 24-year peaks and equity valuations rest on assumptions about perpetual AI-driven expansion. A miss on inflation or a soft earnings read from the majors could reverse the current trajectory faster than anyone expects. JPMorgan, Goldman Sachs, Wells Fargo and Citigroup set the tone this week. If their margin profiles hold against rising borrowing costs and slowing loan demand, the rally continues. If not, the 29.6 percent earnings growth figure becomes a footnote in a much uglier second half. Author bio: Logan Pierce is an independent business researcher and corporate governance writer on Medium, focusing on earnings cycles and macro-financial crosscurrents.
More

The White House Holds 200,000 Bitcoin It Can’t Sell, and That’s the Whole Story

(SeaPRwire) -By: Jonathan Barrett Washington spent eighteen months turning crypto policy into a loyalty test, and the market still fell a third from its peak. That is the uncomfortable fact nobody at the Bitcoin conferences wants to say out loud. Since January 2025, Trump signed a Strategic Bitcoin Reserve order, pushed the GENIUS Act stablecoin law, and ordered a 401(k) rule review. Each move was real, documented, and fast. Yet Bitcoin trades at $83,376.06 as of September 24, 2026, well below the $126,080 record set on October 6, 2025. Friendly government, hostile price action. Something is off in that equation. The reserve came first, on March 6, 2025. Treasury was told to hold forfeited Bitcoin in custodial accounts and never sell it. David Sacks claimed the government owns about 200,000 Bitcoin, but no full audit exists. Then the GENIUS Act landed July 18, 2025, mandating 1:1 reserves, audits, and licensing for payment stablecoin issuers. Full effect waits until January 18, 2027. The 401(k) order followed August 7, 2025. Labor scrapped its Biden-era crypto warning in May, proposed a formal rule in March 2026, and nothing has taken effect. The CLARITY Act passed the House in July 2025 and sits stalled in the Senate. Now examine the private side of the ledger. Trump's June 30 financial disclosure showed more than $1.4 billion from family crypto ventures in 2025, his largest income source that year. Royalties from the $TRUMP memecoin, launched three days before inauguration. Token sales at World Liberty Financial, which he co-founded with his sons in September 2024. The firm issues USD1, its own stablecoin. In August 2026, the OCC gave World Liberty Trust Company preliminary approval for a national trust bank charter. It cannot take deposits yet. But the president's family now stands to profit from the same stablecoin framework his administration wrote. The industry game is equally transparent. The stablecoin market cap hit $314.68 billion by June 2026. Bank of America's CEO publicly committed to entering the business once legal. A cluster of banks is building a joint stablecoin while JPMorgan doubles down on its own Kinexys network. The Treasury's August 2026 proposed rule frames stablecoins as payment infrastructure, not investment products. Meanwhile, Trump Media added Bitcoin to its balance sheet in July 2025, riding the corporate treasury wave that fed ETF demand. Everyone with proximity to the rulemaking found a revenue line. The compliance lane became a toll road. Then the market delivered its verdict. Inauguration Day set an intraday record. October 6 brought the $126,080 peak. Four days later, on October 10, 2025, a record liquidation wave hit, and Bitcoin slid into 2026. By January, institutions were pulling funds out of Bitcoin ETFs. Analysts blame two specific disappointments. The reserve order triggered no actual government buying, only custody of seized coins. And Congress never passed the market structure bill. Policy theater without capital behind it reads, to professional money, as noise. The deregulation rally ran on expectations. Expectations expired. Watch the Senate on CLARITY and the OCC's final charter decision for World Liberty, because the next twelve months will reveal whether crypto won regulatory capture or merely rented it. Author bio: Jonathan Barrett, lead focus editor for an independent overseas public affairs weekly, covering the intersection of financial regulation, executive power, and market structure for over a decade.
More

The $17 Billion Illusion: Why iGaming’s Growth Story Is Running Out of Fuel

(SeaPRwire) -By: Christian Pierce Flutter Entertainment reported approximately $17 billion in trailing twelve-month revenue. That is a staggering number. It should be. In iGaming, it is not. The sector spent a decade operating under a growth-at-all-costs philosophy. Operators burned through capital acquiring users with promotional credits and sign-up bonuses. Investors turned a blind eye. Revenue growth looked healthy. Now the tide has turned. Wall Street is demanding sustainable earnings. DraftKings has publicly pivoted toward profitability while maintaining user acquisition. But can companies that built their models on acquisition subsidies actually transition to healthy margins? That is the growth deadlock. The regulatory expansion across North American states and provinces has been real. New markets open. Operators enter. But every new market also means fresh competition for consumer wallets. The saturation question is not whether the total addressable market is large. It is whether any single operator can capture enough of it profitably. Right now, the answer remains uncertain. Investors who chased growth at any valuation multiple are now watching margins for the first time. The shift is structural. It will not reverse. The era of paying premium valuations for pure user growth has passed. What matters is whether those acquired users become profitable customers. The transition from subsidy-driven acquisition to organic retention is the single biggest challenge facing this sector. Every operator knows it. Very few are solving it quickly enough. The competitive landscape is dominated by a handful of names. Flutter Entertainment owns FanDuel, Paddy Power, Betfair, and Sky Bet. It has diversified geographic exposure and a massive customer base. That breadth is a genuine moat. It also means Flutter must manage performance across very different regulatory regimes. DraftKings operates sports betting platforms, online casinos, daily fantasy sports products, and digital lottery services. Its North American brand recognition is formidable. DraftKings has invested heavily in improving profitability alongside growth. MGM Resorts International brings established casino brands and loyalty programs through BetMGM. BetMGM has become one of the leading online betting and casino platforms in North America. Strong growth in online sports betting and iGaming has lifted financial performance. The company benefits from established brands, large loyalty programs, digital expansion opportunities, and strong presence in regulated markets. PENN Entertainment operates both physical casinos and digital gaming platforms, investing heavily in online betting expansion. The stock has been volatile, but the digital strategy continues. Investors analyze these names through price-to-sales ratios because many growth-stage operators lack near-term profits. A lower ratio may signal undervaluation or slower growth expectations or higher perceived risk. A higher ratio reflects strong growth expectations. EBITDA margins serve as the real efficiency gauge. Strong margins indicate effective customer acquisition, operational efficiency, and sustainable business models. Market share determines long-term competitive positioning. Companies with dominant positions enjoy lower acquisition costs, stronger brand recognition, better customer retention, and higher long-term profitability. FanDuel and DraftKings continue to hold the leading positions in the U.S. Monthly active users, average revenue per user, customer acquisition costs, and retention rates form the core scoreboard. Companies delivering consistent double-digit revenue growth command higher valuation multiples. But margins matter more now than they did two years ago. The commercial loop is deceptively simple. Regulatory bodies legalize online betting in new states or provinces or countries. Operators enter those markets with aggressive acquisition campaigns. User counts climb. Revenue grows. That is the narrative the market rewards. But the mechanics beneath are strained. Tax increases can compress margins sharply. Several operators have faced pressure from higher gaming taxes and regulatory costs. Increased taxation reduces profit margins and lowers future earnings expectations. Advertising restrictions limit acquisition efficiency. New licensing requirements delay market entry and raise compliance costs. Product limitations restrict what operators can offer in certain jurisdictions. Competition is brutal. ESPN BET entered the sports betting market. Caesars Sportsbook fights aggressively. FanDuel and DraftKings remain the leaders, but dominance in a fragmented market is harder to hold than to lose. Aggressive promotional spending reduces profitability across the board. The endgame is consolidation. Some operators will build genuine brand loyalty and achieve retention without heavy promotional spending. Others will keep burning cash to acquire users who never return. The shakeout will be uncomfortable. Watch retention rates and customer acquisition costs more carefully than headline user growth numbers. Those two metrics will reveal which operators are building a real business and which are renting growth. The operators with the strongest market positions will compound their advantages. The operators without them will get trapped in subsidy competition. The gap will widen. It will widen fast. Regulatory risk compounds the picture. New licensing requirements, advertising restrictions, tax increases, and product limitations can all alter the investment thesis overnight. Gambling remains heavily regulated. Those who dismiss this risk will be punished by the market. Author bio: Christian Pierce, a chief financial columnist and markets commentator covering growth-stage sectors, equity valuation dynamics, and regulatory tailwinds in digital economy investments.
More
Tom Lee’s $5,000 Dream vs. The $200 Million Exit Business

Tom Lee’s $5,000 Dream vs. The $200 Million Exit

(SeaPRwire) - By: Oliver Hawthorne Tom Lee is not just a Fundstrat analyst. He chairs BitMine, a major corporate holder of crypto assets. His call that Ethereum will hit $5,000 by the end of 2026 is not a detached academic forecast. It is a signal from a position holder. He wants to see the price double. The market is reacting, but the reaction is split. We have a clear disconnect between the bullish narrative and the immediate on-chain reality. The facts are stark. ETH traded near $2,500 on October 11. Bitcoin pushed toward $81,000, and XRP sat near $1.40. Earlier in the month, ETH broke $2,700 before dropping to $2,405. Buyers stepped in. Ali Charts points to a neckline at $2,520. A close above that level targets $2,640. That is a 4.8% gain. Meanwhile, U.S. spot Ether ETFs saw $201.9 million in outflows on October 6. Bitcoin ETFs took in $118.8 million the same day. About $165 million in leveraged ETH long positions were liquidated during the recent drop. Lee ties ETH to Bitcoin. He projects $7,500 for ETH if Bitcoin reaches $100,000. He cites the Glamsterdam upgrade in Q4 2026 and the CLARITY Act as catalysts. More than one-third of all ETH is staked. This reduces tradable supply. Higher network activity increases ETH burning. The macro calendar is heavy this week. ADP data, inflation reports, and Fed remarks are all on the docket. The technical setup is fragile. The MACD histogram turned positive, but momentum is fading. The commercial loop here is about leverage and lock-up. Staking locks up over a third of the supply. ETF outflows create direct selling pressure. You cannot hold a bullish line when institutional money is exiting. Lee’s target requires a 99.3% gain in less than three months. That is not a prediction. That is a hope backed by a large position. The market will decide if the staking math beats the ETF flow. Author bio: Oliver Hawthorne is a Principal Correspondent permanently stationed at an international technology review, focusing on digital asset markets and institutional investment strategies.
More
Bitcoin Traders Want To Declare The Bear Market Dead. The $80K–$87K Range Is Not Letting Them. Business

Bitcoin Traders Want To Declare The Bear Market Dead. The $80K–$87K Range Is Not Letting Them.

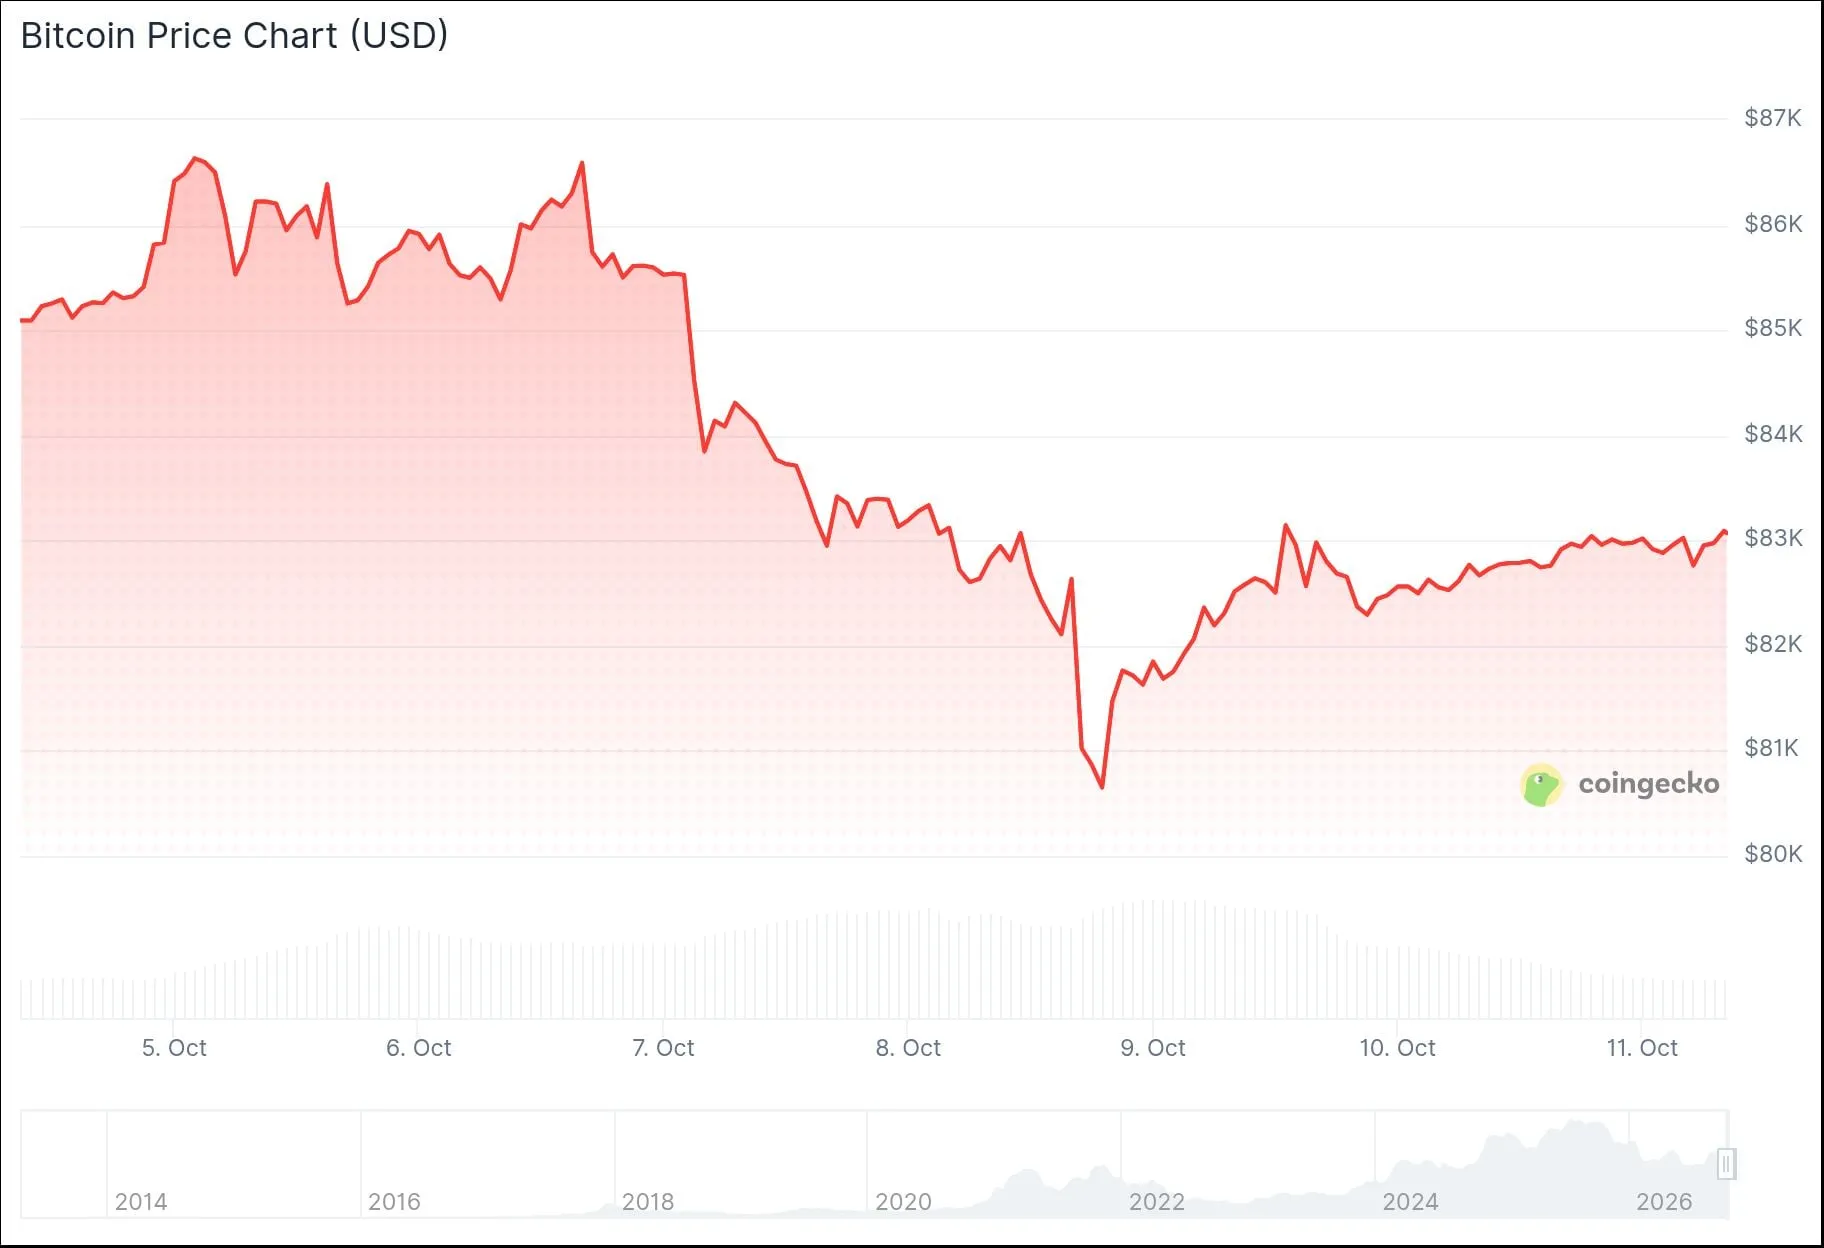
(SeaPRwire) - By: Oliver Hawthorne Bitcoin is being sold a comfortable story right now. Two popular analysts have publicly declared that the bear market could be over. That makes a great headline. It is a much harder trade when it meets the chart data. BTC trades near $83,893. It remains trapped between $80,314 and $87,397. A range is not a breakout. A range is not a new bull market. The RSI reads 55.13, mildly bullish. The MACD tells a different story: bearish in the short term. The trendline from the August low is intact, but buyers had to rescue it after a careless dip. That is not the behavior of a coin that has escaped its bear phase. That is the behavior of a coin waiting for permission. Permission will come from macro data, not from Twitter charts. The anxiety underneath is simple. Nobody wants to miss the recovery, and nobody wants to buy a fake breakout. Now let’s walk through the evidence without romance. The Oct. 12 Coinbase daily chart showed an open near $83,678, a high around $84,200, a low near $83,354, and a recovery around $83,893. The lower end of the range at $80,314 is the key support. A loss of that opens the door to the high-$70,000s. The upper end at $87,397 is a high-liquidity zone. A genuine close above it would make a new breakout attempt credible. The nearest support sits between $83,000 and $83,500, close to the recovered trendline. The technical internals are not as clean as the narrative. The RSI at 55.13 is mildly positive. The MACD line sits below its signal line, and the histogram is negative. Momentum has not yet upgraded. The ETF flow picture is also messy. U.S. spot Bitcoin ETFs took in $118.8 million on Oct. 6, then lost $484.9 million on Oct. 7. That came after an $89.8 million outflow on Oct. 5. The two earlier days were better. Oct. 2 brought $189.9 million, and Oct. 1 brought $102.7 million. BlackRock’s IBIT remains the cumulative leader, and total net inflows across all U.S. spot Bitcoin ETFs stand near $57.4 billion. That large pool of assets has turned into a mechanical flow channel. When money leaves these funds, BTC has to absorb the sell pressure. The bullish long-term case does have a real anchor. Coin Bureau highlighted Glassnode data showing BTC’s MVRV momentum has turned positive, the same recovery signal seen in 2019 and 2023. The MVRV ratio stands at 1.54, above its annual average of 1.44. Ash Crypto added on Oct. 12 that Bitcoin just confirmed a fourth consecutive weekly close above the 50-week moving average. Historically, that has meant the bottom is in and a new bull market has started. Those are meaningful signals, but they are measured on weekly cycles, not on daily traction. Meanwhile, the macro calendar is the real controlling variable. U.S. CPI lands Wednesday, with PPI and retail sales due Thursday. Reuters reported that oil prices eased after President Donald Trump claimed an energy ceasefire between Russia and Ukraine. That may cool inflation pressure at the margin. But traders are not relaxed. Inflation expectations are elevated, and Treasury yields are high. A stronger-than-expected CPI reading would likely strengthen the dollar and push yields higher. That is exactly the kind of setup that triggers ETF outflows. Here is where narrative meets financial machinery. Spot Bitcoin ETFs have become the main demand channel. With total net inflows near $57.4 billion, those funds are the bridge between macro capital and BTC price. That creates a feedback loop. Low yields and soft inflation bring inflows. Inflows push price up. Strong price brings attention. Attention brings more inflows. The reverse loop is equally dangerous. High yields push money out. Outflows push price down. A rangebound asset with outflows feels like a falling knife. Wednesday’s CPI report is the switch. A hot number likely drags BTC toward $80,314. A cool number makes $87,397 the live target. Let me be blunt about the commercial logic. ETF issuers earn fees on managed assets. They have every incentive to keep a bullish narrative alive during rangebound markets. That is not a conspiracy. That is the product structure. It means phrases like “bear market over” can be rational for issuers to repeat and premature for traders to trust. The market only pays out when the range breaks. The practical route is simple: wait for the data. If CPI is cool and BTC closes above $87,397, the recovery narrative deserves its validation. If $80,314 fails, the bear-market-over talk needs to be parked. The next stop would be the high-$70,000s. Until that range resolves, calling the bear market over is a preference, not a conclusion. Author bio: Oliver Hawthorne, Principal Correspondent at a leading international technology review, covering digital asset market structure, institutional flows, and crypto-native derivatives.
More

Your $150 Security Device Just Became an $86 Million Con: Inside the Ledger Hardware Assassination

(SeaPRwire) - By: Silas Sterling There is a moment in every hardware security lifecycle where the product stops being a machine and starts being a marketing promise. Ledger is that promise. The company has spent years selling one thing above all else: physical isolation. Your private keys live on a device. They never touch the internet. The logic was clean. It was also brittle. On October 10, a researcher named Mark Karpelès posted about finding extra electronics behind the screen of a Ledger Nano X sourced from Malaysia. The packaging looked intact. Tibane Labs examined the device and described a microcontroller and cellular hardware linked to the screen's data lines. That means the implant could have captured your recovery words at the exact moment you typed them during setup. It doesn't need network access to your computer. It doesn't need to exploit an OS vulnerability. It just waits. What makes this attack structurally devastating is that Ledger has confirmed zero evidence of its own systems or services being compromised. The attack surface is the supply chain between factory and customer, not the firmware. The device never communicated with Ledger's servers. The data left the unit through a cellular module and entered a victim's wallet via a completely separate exfiltration path. The cryptographic guarantees that underpin hardware wallets are still technically sound. The point of trust has simply moved three centimeters further downstream. CZ nailed the operational reality on X when he observed that the hackers apparently bought the reseller and made them sign a non-disclosure agreement to keep their mouth shut. CryptoBilis sells in Indonesia, Malaysia, and the Philippines. Reports of unauthorized transactions began on October 9. Former executives say they handed over control of the business in March after an ownership change. The statement does not name who modified the device. This is not a random refurbishment operation. It is a coordinated supply chain infiltration. Here is the part that should terrify anyone building hardware security products. Specter estimates losses may exceed $86 million across Bitcoin, Ethereum, and Tron. Bitquery puts the number even higher at $92.9 million flowing out of 311 wallets, with roughly $70.5 million from Tron and $16.8 million from Bitcoin. About $10 million in USDT has been frozen. PublicAML reported approximately 900 ETH reaching Tornado Cash on October 10. Ledger has not confirmed any of these loss figures. It has not confirmed that the implant caused the thefts. It has confirmed only that one device was physically tampered with. The gap between what we know and what we can prove is exactly where the industry lives now. The attack proves that hardware wallets are only as secure as the weakest link in their distribution chain. Secondary market resellers become structural liabilities. The trusted vendor model is dead. Every wallet sold outside an official channel now carries a probability distribution of compromise that no consumer can meaningfully assess. The open-source security community will respond the way it always does. People will reverse-engineer tamper-evident packaging standards. They will propose supply chain attestation protocols using blockchain verification of serial numbers from factory to end user. They will document what to look for when opening a device for the first time. None of this changes the fact that the average user cannot solder a microcontroller out of a Nano X without destroying it. Ledger's current guidance is blunt. Buyers from CryptoBilis should not set up their devices. If you already did, move funds to a new wallet with a new recovery phrase. Support staff will never ask for your 24-word phrase. Anyone with information should contact bounty@ledger.fr. This is damage control, not product redesign. The hardware wallet industry now faces a choice. It can pretend this is an isolated incident involving one reseller and hope the secondary market stops treating these devices like consumer electronics. Or it can accept that physical supply chain verification must become a first-class security requirement, on par with air-gapped cryptography and secure element certification. The market will pick the cheaper option. That is the part that will keep you awake tonight. Author bio: Silas Sterling is a veteran kernel contributor and editor-in-chief of an open-source security digest, focusing on supply chain integrity and hardware root-of-trust vulnerabilities.
More
Nvidia’s $800 Million Bet on Reflection AI Reveals a Desperate Consolidation Play Business

Nvidia’s $800 Million Bet on Reflection AI Reveals a Desperate Consolidation Play

(SeaPRwire) - By: Reginald Vance Nvidia closed Friday at $229.28, down $1.20. That fourth straight daily decline puts it 6% below the all-time high of $243. The Financial Times reported over the weekend that Nvidia is in early talks to acquire Reflection AI or raise its stake. The chipmaker already committed $800 million to the startup, which was last valued at $25 billion pre-money. Reuters could not verify the report. Neither company has commented. The deal could arrive within weeks. An acqui-hire structure would let Nvidia bypass the regulatory drag that a traditional takeover invites. That is how they handled Groq. Groq employees sued last week claiming they were undercut. Nvidia is executing a deliberate consolidation strategy across the full AI computing stack. They agreed to buy Hugging Face weeks ago in a deal valued above $13 billion. Now they are circling Reflection AI, a company founded in 2024 by former Google DeepMind researchers Misha Laskin and Ioannis Antonoglou. Reflection builds tools that automate software development. Its Beam model targets coding and agent tasks and launched Monday as an open-weight offering priced to compete against cheaper Chinese alternatives like DeepSeek and Kimi. The acquisition would be Nvidia's biggest yet. The buyout price would land well above the $25 billion pre-money valuation Laskin discussed on CNBC back in April. The pressure on Nvidia's portfolio tells a different story than the acquisition headlines. SoundHound AI has fallen to its lowest level since 2014. Marvell dropped to $275 from a record of $329. Arm Holdings is down more than 46% from its peak. Neocloud names like IREN, CoreWeave, and Nebius have all retreated. Firmus postponed its IPO after investors rejected its valuation. OpenAI, another major Nvidia investment, missed revenue expectations by $20 billion annually, landing at roughly $50 billion instead. The one bright spot is Lumentum, which hit a record $1,140 after management said products are sold out through 2029. The chart shows a rising wedge with resistance around $243 and support near $220. A break below $220 opens the door to $210. The RSI cooled to 53 from 68. The MACD histogram narrowed to 0.13, suggesting bullish momentum is close to flipping. Nvidia's hardware dominance requires continuous software-layer absorption to maintain margin control. The Pattern is clear: acquire the platform, acquire the data layer, acquire the development tooling. Each purchase compresses an independent layer into Nvidia's architecture. Capital efficiency matters less than boundary control when you are building an infrastructure fortress. The chip supply agreements and foundry data support this thesis, but so does the portfolio rot. Every falling Nvidia-backed name reinforces the urgency of acquisition speed. The endgame is not revenue growth. It is vertical enclosure of the entire AI value chain before any competitor can replicate the integrated stack. Author bio: Reginald Vance is a venture partner specializing in semiconductor valuation and advanced materials, with a focus on capital deployment strategies in the AI infrastructure sector.
More

Uber Lost Africa to a $2,500 Income Ceiling. Wall Street Cheered for 50,000 Job Losses.

(SeaPRwire) - By: Robert Kensington Uber killed 50,000 jobs in Nigeria overnight, and the worst part isn't the death toll. It's how they did it. No phone call. No email. No meeting. An Abuja driver scrolled through his Instagram feed and realized he was out of work. That's not a corporate retreat. That's a hostage release with the gun pointed at the wrong hostage. Uber Technologies ended operations in Nigeria and Uganda on September 2, 2026. The Amalgamated Union of App-Based Transporters of Nigeria confirmed the number. Roughly 50,000 drivers relied on the platform for income before the closure. Fifty thousand people found out about their unemployment on social media. And somehow, UBER stock closed up 1.81% at $71.51 on the same day. The market treated this as good news. The drivers in Abuja didn't get that memo. I've spent decades watching companies expand into new markets. When you see a platform pull out of four African countries in twelve months, you don't see strategy. You see triage. And the triage was never about strategy. It was about survival economics meeting a poverty ceiling that no amount of safety features could breach. The exit wasn't about bad local partners or regulatory nightmares. It was about a pricing model that can't survive when the customer's wallet is the bottleneck. Here's what Uber officially says. The company claims it remains committed to the African region. It points to over one billion trips completed on the continent to date. It announces a plan to invest more than $300 million in South Africa. Wall Street applauded. The stock moved up. But flip the script. Uber ended operations in Nigeria and Uganda on September 2, 2026. That followed earlier departures from Tanzania and Ivory Coast over the past year. Four markets, gone in twelve months. The official narrative calls this a strategic realignment. The industry subtext calls it a retreat from every market where GDP per capita falls below $2,500. Equity Group Holdings' chief economic adviser said it plainly — Uber's realistic market floor sits around $2,500 GDP per capita. Nigeria and Uganda don't make that cut. South Africa holds at roughly $7,500. Kenya sits around $2,700. Those are the lowest income levels among countries where Uber still runs. The $2,500 line is not a strategy. It's a confession. Uber's commitment to Africa exists, but it only exists where the wallet is big enough to absorb the premium. The billion trips stat is the ghost of a market that once could have been. The real story isn't expansion. It's a geographic boundary being drawn around what Uber can afford to serve. Every country Uber left has a GDP per capita under $2,500. Every country Uber stayed has one above it. That's not a coincidence. That's a spreadsheet. Uber positions itself as the premium ride-hailing option across Africa. Higher vehicle standards. Stronger safety features. Those are real differentiators on paper. They don't matter at checkout. In Nairobi, a typical Uber trip runs 273 Kenyan shillings. Bolt charges 220 shillings for the same ride. In Johannesburg, Uber's cheapest fare hits 50 rand. Bolt takes 39 rand for an equivalent trip. That's a 20% and 22% discount respectively. Bolt now operates in eight African countries, ahead of Uber's six. The company counts over a million drivers and couriers on its continental platform. inDrive takes a completely different approach — riders and drivers negotiate fares directly, bypassing Uber's algorithmic markup entirely. Yango has also expanded its footprint across the continent. Uber recently introduced an electric vehicle option in South Africa to compete with Bolt's cheaper offerings. The move reads less like a product launch and more like a panic counteroffer. Meanwhile, Moove, a Nigerian mobility startup valued at $2.1 billion, announced on October 8 that it also plans to exit the country. Moove had built part of its business supplying vehicles to Uber drivers. The network of suppliers and partners that supported Uber's African ambitions is collapsing from the outside in. When your own suppliers start leaving, you know the market has voted. And in this case, the vote wasn't subtle. The official story says Uber is investing in Africa. The industry reality says Uber is investing in the parts of Africa it can survive in. There's a difference, and it's called market share. Uber built its African pricing model on quality and safety. But quality and safety cost money. And in markets where the average income is below $2,500 a year, money is the only variable that matters at checkout. One Abuja driver told reporters his weekly income dropped by a third after switching to Bolt and inDrive. That's not an exception. That's the pattern. Drivers who lost access to Uber are adjusting to lower pay on every other platform available to them. Nigeria's Federal Competition and Consumer Protection Commission has launched an investigation into Uber's departure. The union representing drivers has contacted the country's labor ministry. Uber still operates in Nigeria through a local unit of its Delivery Hero food-delivery business. It remains unclear if regulators can take action against the ride-hailing side. Mordor Intelligence projects Africa's ride-hailing market will grow nearly 30% by 2031, reaching $3.25 billion. The growth is real. Urbanization and smartphone adoption are pushing demand. More phones mean more potential riders. Uber's share of that growth is vanishing. The growth belongs to whoever charges less. The company built its African story on safety and vehicle quality. In a market where riders earn less than $2,500 a year, safety is a luxury good. It's not the default option. Bolt, inDrive, and Yango learned that lesson when Uber was still in the room. Uber is paying to relearn it now. The question is whether it will learn fast enough. The map of ride-hailing dominance in Africa is being redrawn one market at a time. Uber is watching the pen go down. And the pen isn't held by Uber. The market has made its choice. And the choice was made before Uber left. The question now is whether Uber can accept losing the continent's largest ridership base without rewriting its entire pricing model. I don't think it will. They want growth. They don't want to reprice. That's why the exits are permanent, not temporary. The door is closed. And they won't be the last. Not if Uber keeps playing the premium game in the wrong markets. Author bio: Robert Kensington, an overseas entrepreneurial veteran with over two decades in real-economy industrial investment and cross-border market expansion. Covers corporate retreats, market share wars, and the economics behind corporate geography.
More

Don’t Blink at the DraftKings Dump. The SpaceX Sale Is Cathie Wood’s Loudest Signal

(SeaPRwire) - By: Oliver Hawthorne The October 9 trade sheet from ARK Invest reads like a portfolio-wide confession. Cathie Wood sold DraftKings, CareDx, SpaceX, AMD, Alphabet, Robinhood, Shopify, the Bitcoin ETF, and Iridium Communications in a single session. That is not a tidy tax-loss harvest. It is a deliberate cliff dive out of consumer tech, mega-cap compute, and speculative mobile trading. The action on the buy side is even louder. Almost every fresh dollar went into ARKG, the genomics fund, which added CRISPR Therapeutics, Intellia, Beam, Nurix, Guardant Health, Kymera, Compass Pathways, Almar Biosciences, and Freenome. The market rewarded that call immediately. ARKG closed up more than 4 percent on Friday. CRISPR jumped 5.85 percent. Beam rose 4.47 percent. Compass Pathways climbed 4.62 percent. DraftKings, by contrast, fell 1.46 percent. AMD dropped 2.03 percent. The crowd, though, is not on board. Retail sentiment on Stocktwits around ARKG is bearish right now. That gap between institutional behavior and the public mood is one of the cleanest contrarian setups of this cycle. The scale of the sell-down matters. ARK sold 397,016 DraftKings shares through the ARKW and ARKF funds, worth roughly $7.89 million. That continues a multi-day sell-off in DKNG. At the same time, ARKG cut 57,911 CareDx shares, valued at $3.60 million, and kept trimming that position all week. The ARK Innovation ETF reduced stakes in five high-profile names: SpaceX, Advanced Micro Devices, Alphabet, Robinhood Markets, and Shopify. ARKG also cut Personalis. The ARK Space & Defense ETF dumped Iridium Communications. None of those are weak balance sheets. SpaceX is a hard-to-access private asset. AMD has real data-center traction. Alphabet prints cash. Selling private SpaceX shares is the brutal part of this disclosure. You do not casually liquidate a pre-IPO stock with long-term structural demand unless you need firepower for something with more perceived upside. That something is a broad basket of gene-editing and molecular diagnostic companies. ARK bought 21,487 shares of CRISPR Therapeutics for $1.08 million. It added 48,171 shares of Intellia Therapeutics for $606,954. It grabbed 56,096 shares of Nurix Therapeutics, valued at $1.24 million. Guardant Health received a $1.19 million order. Kymera, Compass Pathways, Almar, and Freenome also saw inflows. The pattern is impossible to miss. This is a frontier rotation, a sprint toward early-stage genomics, and a retreat from crowded tech names that have already enjoyed their valuation expansion. The real logic here is not about daily performance. Unprofitable drug developers need cash to run clinical programs. ARK, by buying them now, is positioning itself ahead of a wave of secondary offerings. When a company like Intellia or Beam announces a raise, the share price usually takes a hit. ARK can buy more because assets under management keep flowing as the fund outperforms. That is the loop. It only breaks if clinical readouts fail. Then the dilution becomes toxic. But the bearish Stocktwits sentiment means the general public is not yet chasing this rally. That gives ARK room to fill its basket at prices that still look cheap compared to a 2027 scenario where multiple late-stage trials can produce visible commercial revenue. The real risk is not regulatory scrutiny or U.S. Food and Drug Administration indifference. It is neglect over time. If the catalysts come and go without actual product sales, ARKG turns into a giant machine that feeds capital into an endless pipeline of hope. If the catalysts land with strong safety and efficacy data, these gene-editing names become takeover targets for big pharmaceutical companies. There is no middle ground here. Private SpaceX shares were sold to fund a binary bet. That single move frames the entire trade: high conviction, high burn, high reward. The winner will be known only when the data arrives. Until then, the only disciplined trade is to respect the allocation change and ignore the crowd’s mood. Execution, not sentiment, is the whole game. Author bio: Oliver Hawthorne, Principal Correspondent for The Global Tech Review, covers technology valuations, speculative capital flows, and genomics disruption. He has spent more than two decades reporting on how frontier science changes investment logic across global markets.
More
$36,000 In, $149,000 Out: The Ugly Math Wall Street Hopes You Never Run Business

$36,000 In, $149,000 Out: The Ugly Math Wall Street Hopes You Never Run

(SeaPRwire) - By: Christian Pierce Here is the anxiety nobody in the brokerage business wants to price in. The average retail investor believes wealth is built through clever trades. It is not. It is built through a boring monthly transfer that most people abandon in year three. Run the arithmetic on $100 a month for 30 years and the numbers get uncomfortable fast. You deposit $36,000 of your own money. At an assumed 8% annual return with monthly compounding, that grows to roughly $149,036. About $113,036 of that total is pure investment growth. Your contribution is less than a quarter of the ending balance. The market did the heavy lifting. That is the core contradiction at the heart of modern retail finance. The industry sells stock-picking apps, options dashboards, and meme-driven trading adrenaline. The actual wealth engine is a silent automated deposit into a dull index fund. The product that works best is the product that generates the fewest fees. Remember that tension. It explains almost everything about how the investment industry markets itself to small savers. The projection is honest about its own limits, and the sensitivity table deserves more attention than the headline figure. At a 4% annual return, the same $36,000 in deposits becomes only about $69,405. At 6%, roughly $100,452. At 10%, around $226,049. The spread between 4% and 10% exceeds $156,000 on identical monthly contributions. Two investors with identical discipline end up in different financial universes based purely on the return regime they happen to live through. Timing matters at the back end too. At 8%, the balance sits near $18,295 after 10 years and $58,902 after 20. Then it jumps to $149,036 by year 30. Most of the growth arrives late. That is compounding's well-known cruelty. Quit at year 15 and you capture almost none of it. For historical context, the S&P 500 has averaged about 10% a year over its history, and posted an annualized 10.4% over the 30 years through December 2025, per Fidelity. But those are backward-looking figures. A low-cost index fund tracking the S&P 500 holds hundreds of large US companies, yet it still falls when the broad market falls. Dollar-cost averaging means buying more shares when prices are low and fewer when high. It does not guarantee profit or protect against loss. A sharp drawdown right before retirement can gut the final number regardless of the long-run average. Then comes inflation. At 2.5% annual price growth, that $149,036 buys what roughly $71,000 buys today. Fees and taxes shave it further. Strip the marketing away and the commercial loop here is simple. The investor's optimal strategy, steady monthly deposits into a cheap index fund with reinvested dividends, is the least profitable strategy for the financial industry. One $100 monthly purchase of a near-zero-fee fund generates almost no revenue for anyone. Active trading, by contrast, mints money for platforms. So the industry's incentive runs directly against the customer's outcome. That misalignment is the real story, and no projection chart will fix it. The endgame is already visible. Fees compress toward zero because scale winners absorb the flow. Advice migrates to automated allocation. The firms that survive will be the ones that monetize attention, lending, and cash balances rather than transactions. For the saver, the actionable conclusion is blunt. Automate the deposit. Reinvest the dividends. Raise the contribution whenever income rises, since $200 a month at 8% projects to about $298,072, exactly double the $100 figure. Then ignore the market for years at a stretch. The math does not reward intelligence. It rewards presence. Thirty years of showing up beats thirty years of being clever, and that is the one trade with no counterparty. Author bio: Christian Pierce is a chief financial columnist and markets commentator who covers retail investing behavior, index fund economics, and the business models of the brokerage industry.
More
The Quiet Exodus: Why Nine Straight Days of Outflows Should Haunt Every Crypto Trader This Week Business

The Quiet Exodus: Why Nine Straight Days of Outflows Should Haunt Every Crypto Trader This Week

(SeaPRwire) - By: Christian Pierce There is a dangerous disconnect in the current market narrative. Everyone is glued to the top-line Bitcoin price hovering near $83,000. They talk about the next ATH. They ignore the bleeding. The institutional bid is breaking down. U.S. spot Bitcoin ETFs saw a meager $21.1 million in inflows on October 9. That is a trickling. Over the prior five sessions, the net flow was down by roughly $679 million. This is not accumulation. This is a slow, steady retreat by the smart money. The retail floor is catching the falling knife, but the players who hold the most power are leaving. The damage is worse elsewhere. Spot Ether ETFs lost $56.1 million on October 9 alone. That marks the ninth consecutive day of net outflows. Since then, withdrawals total around $697 million. Two heavy sell-offs hit on October 6 and 7, draining $201.9 million and $160.9 million respectively. Yes, net inflows since launch still sit at $13.3 billion. But the trend is the story. Capital is rotating away from ETH. The nine-day streak is a warning flag. It signals that demand for the second-largest asset is evaporating just as volatility spikes. Wednesday’s CPI report will be the match. Economists expect headline inflation near 3.7% and core around 2.5%. The Fed hiked rates in September for the first time since 2023. Traders currently price a 19% chance of another hike on October 28. A hot print will push Treasury yields higher. Higher yields kill risk assets. Crypto is not immune. If the report beats expectations, the "second rate hike" scenario becomes a real threat. Soft data might give hope. But the market is fragile. One miss in either direction could trigger a cascade. The PPI and retail sales numbers on Thursday add more noise to the signal. The token unlocks compound the risk. Aptos releases about 11.31 million APT on October 12. This ends the four-year vesting cycle for early investors. Monthly releases drop sharply after this. Arbitrum follows on October 15 with roughly 92.65 million ARB hitting the market, valued at about $17.5 million. These are supply shocks. They hit exactly when institutional demand is weakest. Friday brings a $1.25 billion Bitcoin options expiry on Deribit. $247.5 million in Ether options settle too. This is a perfect storm of supply, fear, and macro uncertainty. The commercial loop is breaking. Retail buys the dip. Institutions sell the strength. The ETF flow data proves the bid is gone. The CPI report will determine if the Fed stays the hawkish hand it’s building. If rates stay high, the cost of carrying crypto becomes too expensive for the average holder. The endgame is simple. Volatility will return. The "steady rise" narrative is dead. Watch the yields. Watch the Aptos unlock. Watch the options expiry. If you are still talking price targets without looking at flow data, you are trading in the dark. The smart money is out. Are you next? Author bio: Christian Pierce, a chief financial columnist and markets commentator with over two decades of experience analyzing institutional capital flows and macroeconomic impacts on volatile digital asset markets.
More
NEAR Is Selling Quantum Safety. Its Fee Buyback Is Selling the Rally. Business

NEAR Is Selling Quantum Safety. Its Fee Buyback Is Selling the Rally.

(SeaPRwire) - By: Oliver Hawthorne The quantum threat is real. It is also the easiest story to fake in crypto. Any chain can publish a roadmap. NEAR shipped something instead. Accounts on NEAR already support ML-DSA, a digital signature type built to withstand quantum computers. Holders do not need to move coins. No hard fork. No token swap. That is why Saturday's 11% jump deserves attention. But look at the market around it. Total crypto market capitalization rose only about 0.5%. Altcoin market capitalization was flat or slightly lower. So the market did not suddenly price every chain for a post-quantum future. It priced NEAR. There is a difference. The industry-wide anxiety is obvious: most layer-1 accounts rely on elliptic-curve signatures. A sufficiently advanced quantum computer could break them. Fixing that usually means a forced migration. NEAR says it designed for this in 2018. That is a real structural edge. Yet a structural edge does not produce a 121% 30-day run by itself. Something else is paying for the move. Here are the raw facts. NEAR said on Friday that accounts can already use ML-DSA. On Saturday the token rose more than 11%. Over 24 hours it gained more than 12%. The second piece is NEP-655. That proposal hides account keys entirely. It is running on a test network. A full launch is expected within weeks. The wallet contracts for NEAR Intents are also being designed to accept ML-DSA, which ties the quantum work directly to the protocol's busiest product. NEAR Intents lets users move assets between blockchains. Its cumulative DEX volume has reached $33.29 billion. Around $4.76 billion came in the past 30 days. Total value locked stands at roughly $223 million. In the past month the system collected $7.81 million in fees. Of that, $2.15 million went to buying NEAR on the open market and returning it to holders. A draft proposal filed on Wednesday would lower maximum annual token issuance to 1.6% from 2.5% over two years. That is a supply-side cut. NEAR ETFs are adding demand too. Bitwise's NRR product took in about $5.13 million in one day. NEAR ETF assets are now around $66 million. Some other altcoin ETFs saw outflows in the same stretch. The price picture is just as clear. NEAR traded near $5.24 on Sunday. That was up 7.9% over roughly 25 hours. Over 30 days it is up about 121%. Bitcoin is up roughly 6.4% in the same period. Among major altcoins tracked, only NEAR and Cardano were still up over the last week. Now watch the loop. Intents generates fees. Fees buy NEAR. Buybacks shrink floating supply. ETFs add another demand channel. Lower issuance cuts supply growth. That is a pricing engine running under the quantum narrative. The security upgrade is not the actual fuel. It is the story attached to the fuel. Institutional money likes stories that sound durable. "Your accounts are protected from future quantum computers" is a much easier pitch than "our fee buyback is working." Analysts are playing both sides. Michaël van de Poppe called NEAR "such a beautiful chart." He said a sweep of the lows was bullish from a day-trading view. He expects a little pullback before NEAR moves toward new yearly highs. He also said that if this cycle resembles 2017, returns could be substantial as adoption arrives. Jesse Olson says NEAR continues to flip bullish on higher time frames. He points to a breakout of a 4.5-year downward trendline. He expects pullbacks, possibly a retest of that trendline. The RollUp founder Andy posted a video showing Arthur Hayes reportedly remains bullish. At TOKEN2049 in Singapore, NEAR co-founder Illia Polosukhin joked about triple digits. Fine. That is sentiment. The mechanics matter more. The end-game is binary. If fee buybacks keep growing after the quantum hype cools, NEAR has built a durable capital loop. NEP-655 reaches mainnet. The no-migration line becomes a permanent differentiator. If buybacks stall, this is just another momentum trade. So ignore the quantum speeches for a second. Watch the monthly fee number. Watch the buyback line. If NEAR keeps buying itself, the rally has legs. If not, the story will not save the chart. Author bio: Oliver Hawthorne, principal correspondent for an international technology review, covers blockchain infrastructure and market structure. He has spent a decade tracing how protocol upgrades move token prices and institutional capital.
More